Same Bitcoin Crash, Different Regime: Why 2018, 2022 and 2025–26 Are Not the Same Cycle
A similar Bitcoin drawdown can travel through a different macro, credit and cross-asset regime.
A similar Bitcoin drawdown can travel through a different macro, credit and cross-asset regime.
One crash shape, three regimes
Study synthesisThe matrix separates headline evidence from interpretation. Header prices run from each Bitcoin peak to the lowest observed close; the open cycle uses the low through 23 Jul 2026. SPY paths use the nearest available market close because Bitcoin also trades when US equities are closed.
2018
- Peak
- $19,103 · 16 Dec 2017
- Low
- $3,212 · 15 Dec 2018
364 days to low
2022
- Peak
- $67,526 · 8 Nov 2021
- Low
- $15,781 · 21 Nov 2022
378 days to low
2025–26
- Peak
- $124,659 · 6 Oct 2025
- Low so far
- $58,625 · 30 Jun 2026
267 days to low
Initiating shock
Crypto-native speculative repricing; no single verified macro trigger is identified by this dataset.
Macro tightening preceded crypto-credit failures; the study does not reduce the cycle to one trigger.
Crypto-led selloff; one initiating catalyst is not established.
Liquidity & monetary policy
- Policy rate
- +0.78 pp
- Fed balance sheet
- -$364bn
- Policy rate
- +3.75 pp
- Fed balance sheet
- +$51bn
- Policy rate
- -0.46 pp
- Fed balance sheet
- +$160bn
Inflation & oil
- CPI inflation (latest available)
- 2.16% → 2.13%
- 10-year inflation expectations
- 1.87% → 1.83%
- WTI oil
- $57.29 → $51.26/barrel
- CPI inflation (latest available)
- 5.35% → 7.71%
- 10-year inflation expectations
- 2.54% → 2.25%
- WTI oil
- $81.96 → $79.74/barrel
- CPI inflation (latest available)
- 2.94% → 4.18%
- 10-year inflation expectations
- 2.33% → 2.24%
- WTI oil
- $62.49 → $84.38/barrel
Credit conditions
- High-yield spread
- +0.82 pp
- short-term funding spread
- +0.04 pp
- High-yield spread
- +1.61 pp
- short-term funding spread
- +0.29 pp
- High-yield spread
- +0.01 pp
credit stress remains far below earlier crisis windows
Crypto-native leverage
Comparable leverage data is unavailable for this period.
Liquidations and venue failures mattered, but comparable leverage data is unavailable across all three periods.
Crypto stress is visible, but comparable leverage data is unavailable.
Equity-market path
- SPY
- $266.51 → $260.47 (-2.3%)
- worst SPY drawdown inside the window
- -11.3%
- SPY
- $468.93 → $394.59 (-15.9%)
- worst SPY drawdown inside the window
- -25.4%
- SPY
- $671.61 → $746.77 (+11.2%)
- worst SPY drawdown inside the window
- -9.1%
BTC / equity coupling
- BTC/SPY β (60 sessions)
- 2.18
- Correlation (r)
- 0.33
- BTC/SPY β (60 sessions)
- 1.13
- Correlation (r)
- 0.36
- BTC/SPY β (60 sessions)
- 1.89
- Correlation (r)
- 0.54
Policy response
Observed: the Fed kept tightening during the drawdown, paused in early 2019 and began cutting in July 2019.
Observed: the Fed kept tightening through the drawdown, held rates high and did not begin cutting until September 2024.
Current: the policy rate is 0.46 pp lower than at the Bitcoin peak; further action remains conditional because broader markets do not confirm a crisis.
Historical match / break
Match: deep crypto drawdown. Break: comparatively contained inflation and credit backdrop.
Match: forced selling and deep drawdown. Break: unusually aggressive inflation-driven tightening.
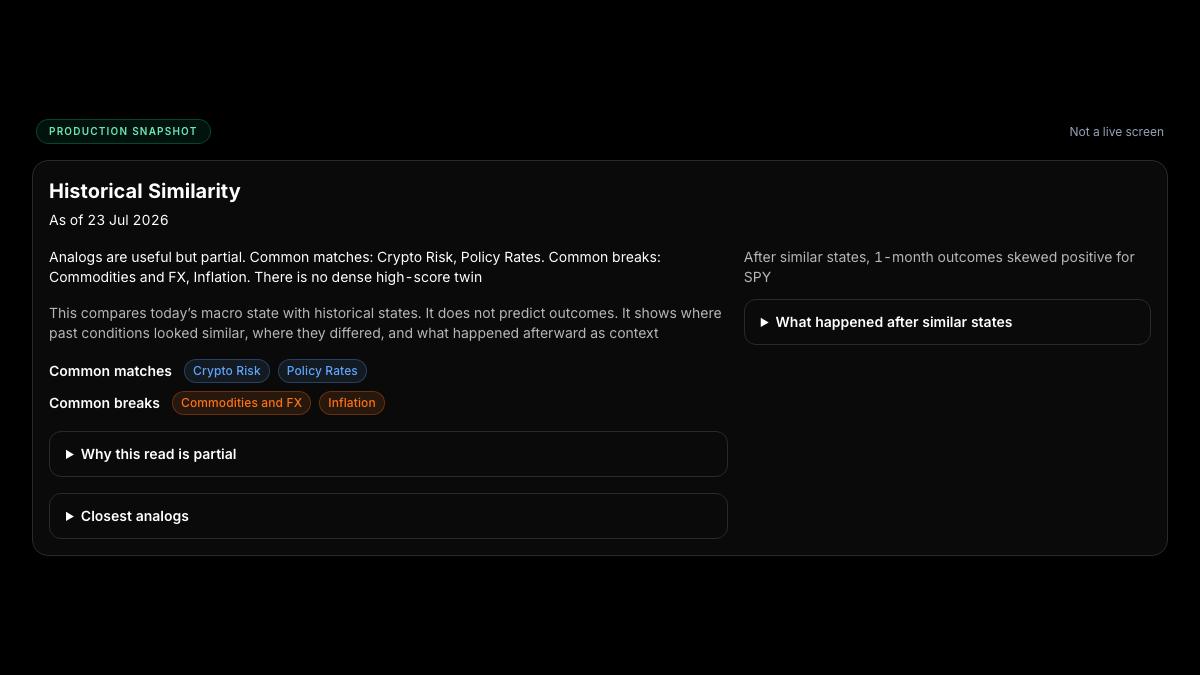
Endpoint match: Corporate credit and Interest rates & US dollar. Break: Crypto drawdown, Volatility, Banks, Liquidity & funding, and Broader equity market are not confirming; credit is milder than prior crisis windows.
What Rug Cleaner saw
The captured reading shows why the conclusion is conditional: similarities matter only when the missing and contradictory signals remain visible.
Three findings
Study synthesisEquity coupling changed across crashes
The fixed 60-session windows do not produce a stable BTC/SPY relationship. Sensitivity fell sharply in 2022 and rose again in 2025–26, while correlation increased across the three episodes.
The policy constraint was not the same
The same liquidation mechanism operated under very different policy constraints: modest tightening in 2018, aggressive tightening in 2022 and slight easing in 2025–26.
The closest analog is still incomplete
At the 2026-07-23 endpoint, stress is concentrated in Corporate credit and Interest rates & US dollar. Crypto drawdown, Volatility, Banks, Liquidity & funding, and Broader equity market do not confirm the same crisis regime, and credit is milder than prior crisis windows.
Conclusion
Forced selling can recur as a transmission mechanism; it is not proof of a recurring causal regime.
Method in brief
Beta and correlation compare shared BTC and SPY daily returns after each episode’s first 10% drawdown. The same fixed window is used for all three periods.
Limitations
- This study uses market data through 2026-07-23. The 2025–26 episode is still open, so the comparison can change.
- Comparable crypto leverage data is unavailable across all three periods.
- Beta and correlation describe association, not causality.